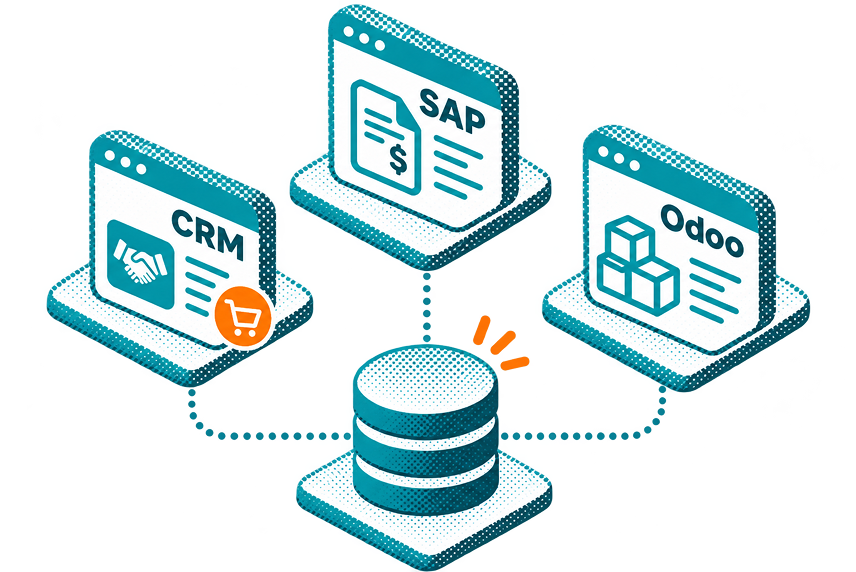
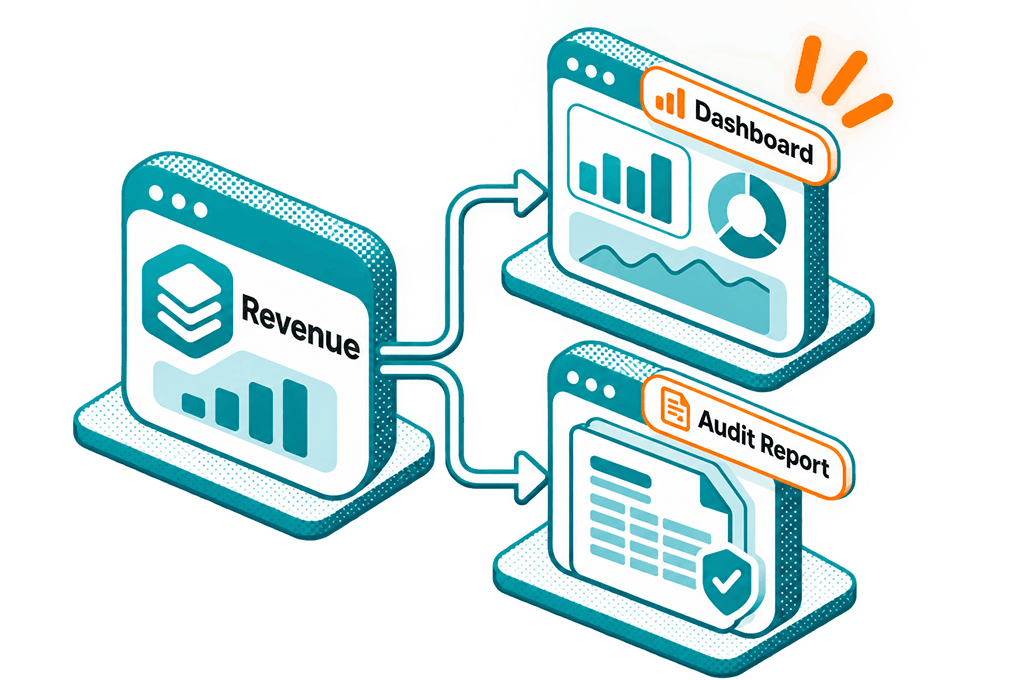
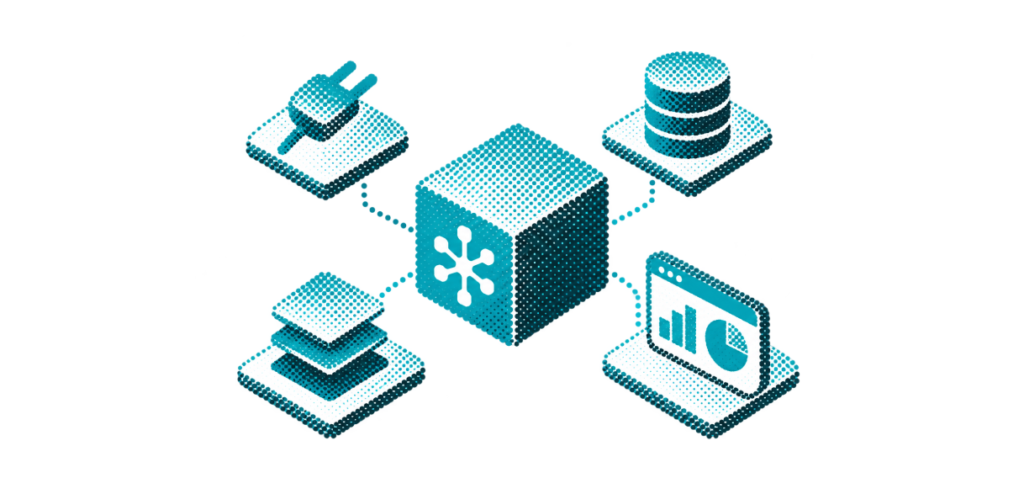
Datarept’s data reporting solutions read data from the systems you already run, keep the original records, turn them into shared models, and build dashboards, reports and answers from those models. Every figure can be followed back to its source record, and access rules decide who sees what.
Datarept is built as layers. Data moves up through them in order, and access rules apply to every one.
Layer
01
Sources
02
Ingestion
03
Raw layer
04
Model layer
05
Experience layer
what it holds
SAP, Odoo, CRM platforms such as Salesforce, databases such as MySQL, SaaS tools, cloud storage (Dropbox, Microsoft OneDrive, Google Drive), APIs, OData, MQTT, files, MCP
Connectors and scheduled pipelines
Original records, unchanged. Embeddings of images, audio and video in vector storage
Charts, dashboards, Report Studio with templates, Crysa (AI copilot)
What happens here
Systems stay where they are and keep running. Datarept connects to 1000+ of them.
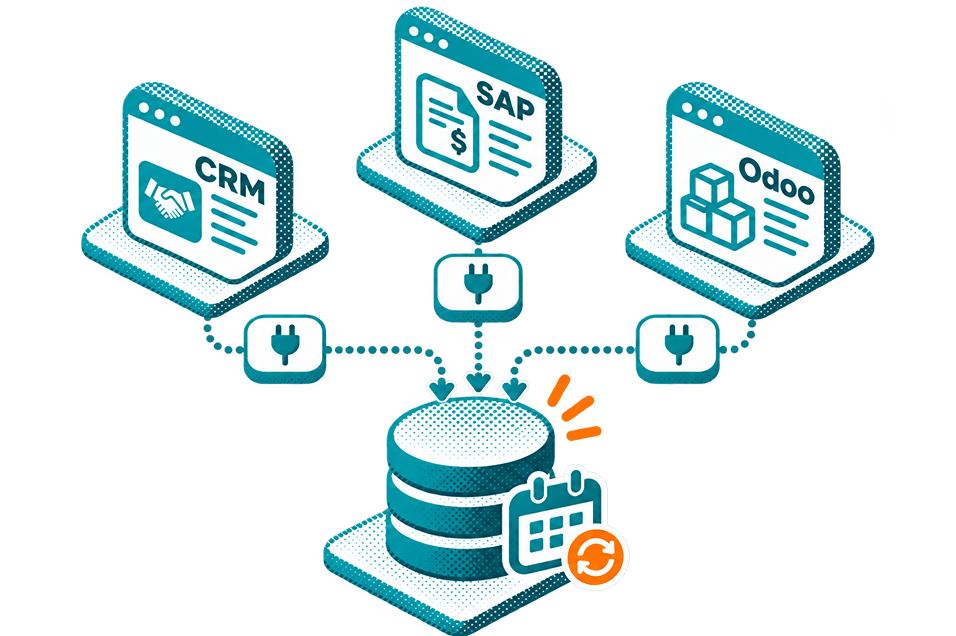
A connector built for each source type loads its data on the schedule you set, or receives events as devices send them.
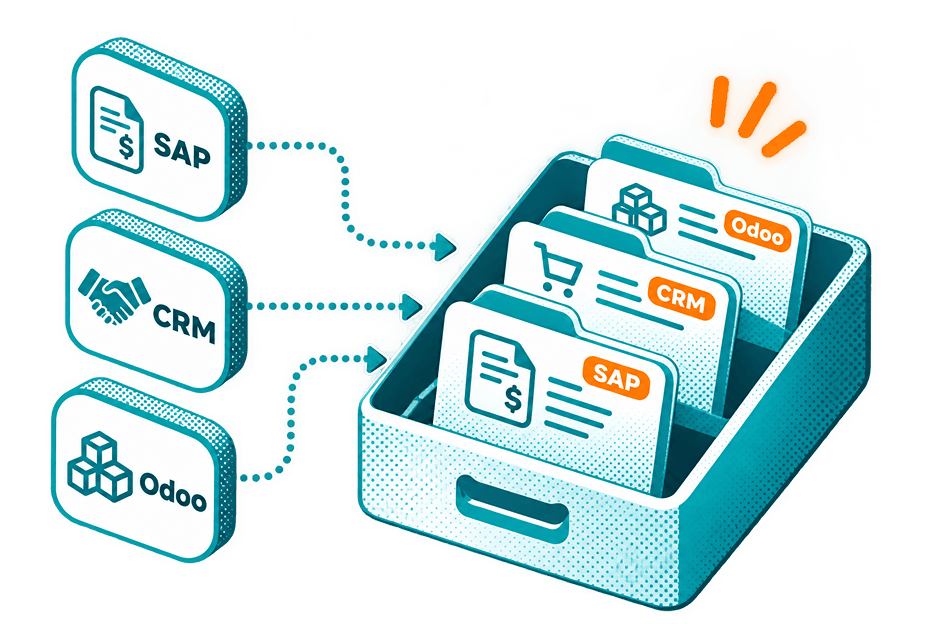
Data is stored exactly as it arrived: same fields, same values.
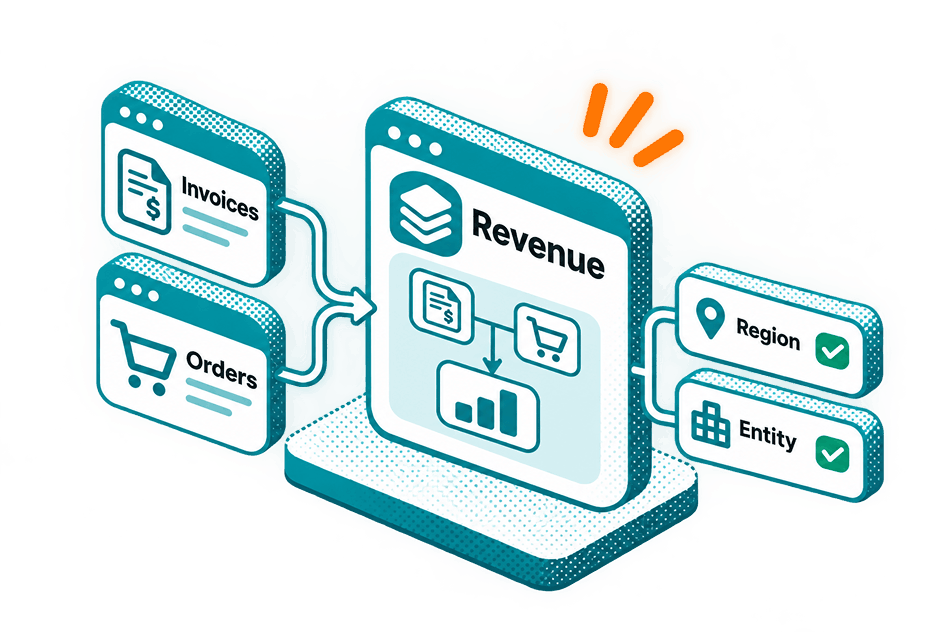
Raw data is organized into models, and each KPI is defined once.
People build views, produce reports and ask questions, all from the modeled data.
Layer
Sources
what it holds
SAP, Odoo, CRM platforms such as Salesforce, databases such as MySQL, SaaS tools, cloud storage (Dropbox, Microsoft OneDrive, Google Drive), APIs, OData, MQTT, files, MCP
What happens here
Systems stay where they are and keep running. Datarept connects to 1000+ of them.
Layer
Ingestion
what it holds
Connectors and scheduled pipelines
What happens here
A connector built for each source type loads its data on the schedule you set, or receives events as devices send them.
Layer
Raw layer
what it holds
Original records, unchanged. Embeddings of images, audio and video in vector storage
What happens here
Data is stored exactly as it arrived: same fields, same values.
Raw data is organized into models, and each KPI is defined once.
Layer
Experience layer
what it holds
Charts, dashboards, Report Studio with templates, Crysa (AI copilot)
What happens here
People build views, produce reports and ask questions, all from the modeled data.
How Unstructured Data Flows
Images, audio and video follow a different path from tables in our data reporting solutions.
01
02
03
04
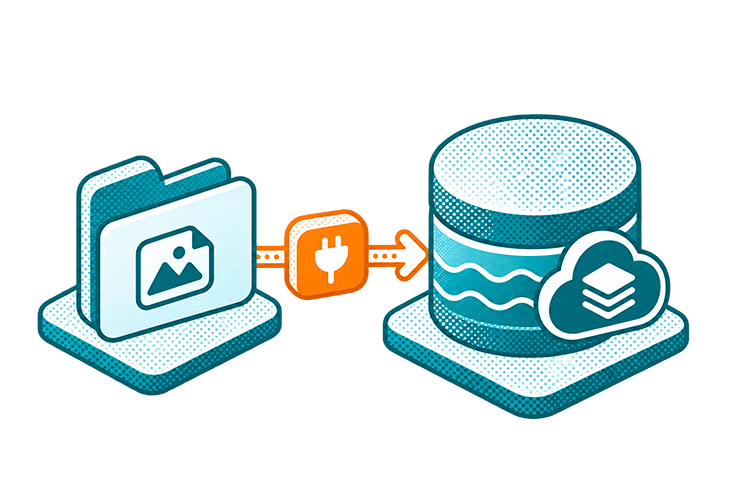
The file arrives through a connector and is stored in a common data lake.
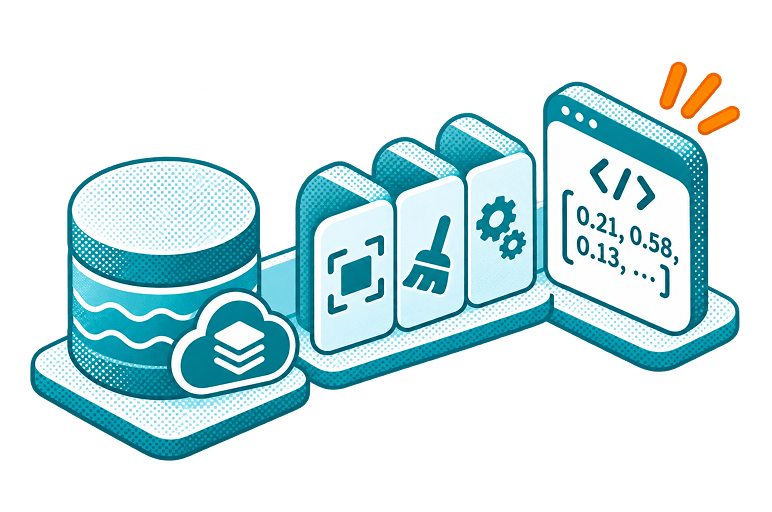
The file is converted into an embedding, a numeric representation of its content.
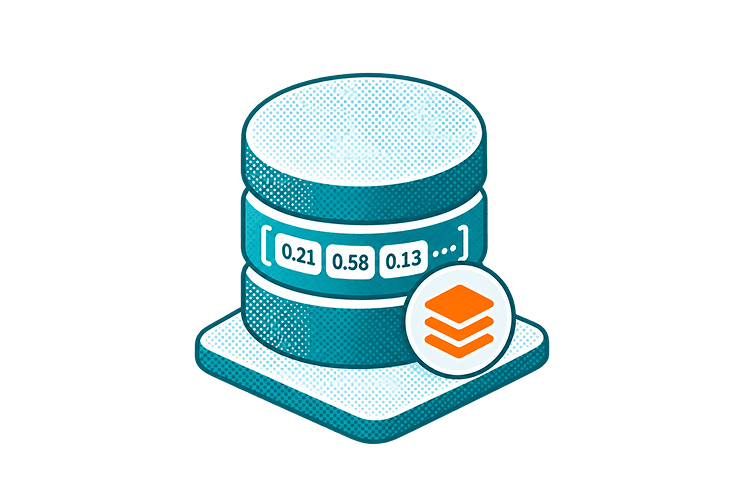
The embedding is held in vector storage.
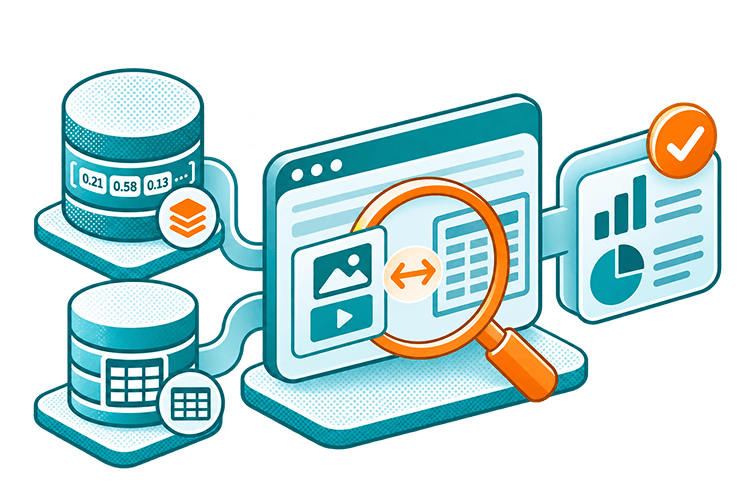
Analysis can compare and retrieve that content alongside structured data.
One Report, Followed From Start To Finish
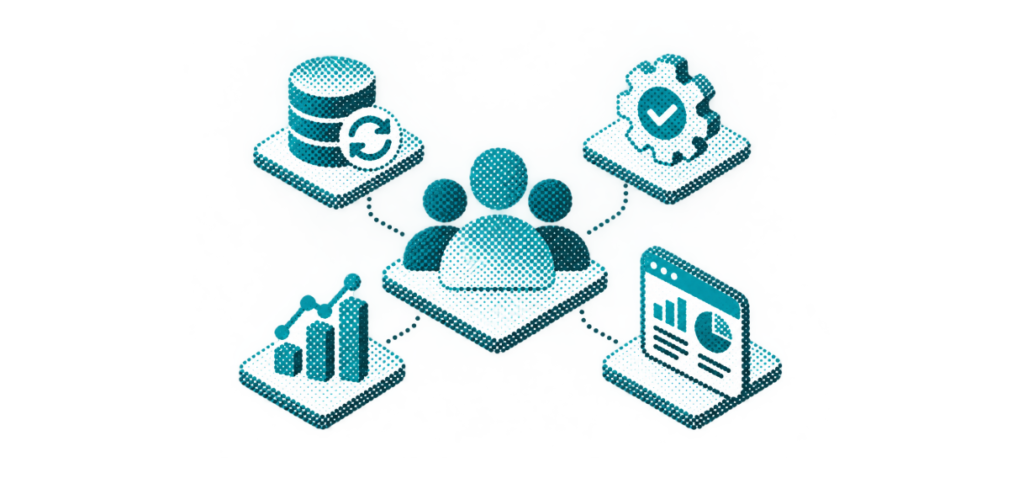
Whatever the team or the report, the path from source system to trusted figure is the same. Here is how Datarept delivers it, and who is involved at each step.
01
Your data stays where it is
Your business data lives in the systems you already use, such as ERP, CRM, databases, SaaS tools and cloud storage. Nothing is replaced or migrated and each system keeps running as it does today.
02
It connects the sources
It selects which sources to connect and sets the refresh schedule. A connector for each system brings data in automatically, with no manual exports.
03
Raw data is stored as-is
Data lands in the raw layer exactly as the source holds it. Nothing is altered on the way in.
04
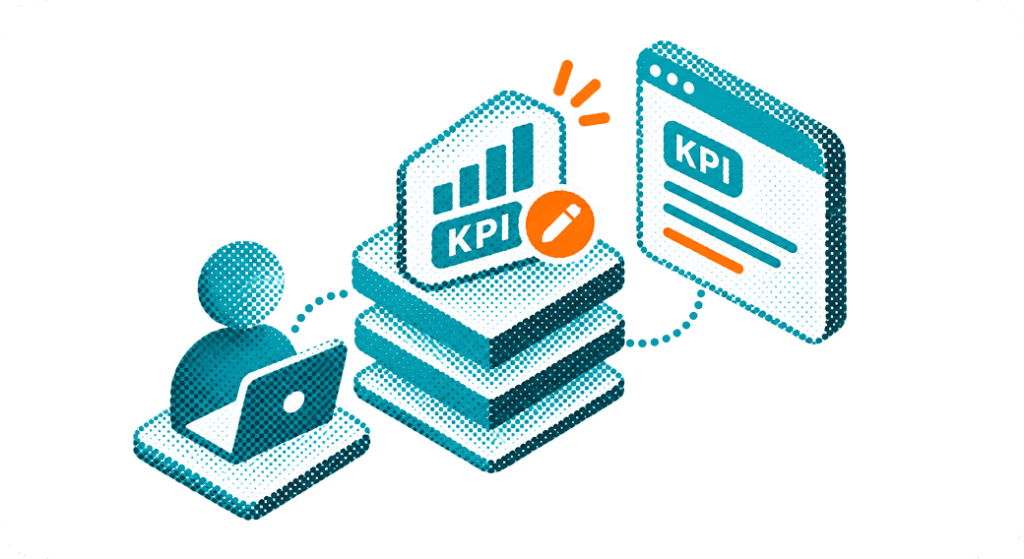
Analysts define each KPI once
Analysts shape the raw data into governed models and define each KPI and its relationships in one place. The definition belongs to the platform, not to any single spreadsheet, so every team works from the same figure.
05
Teams build the views they need
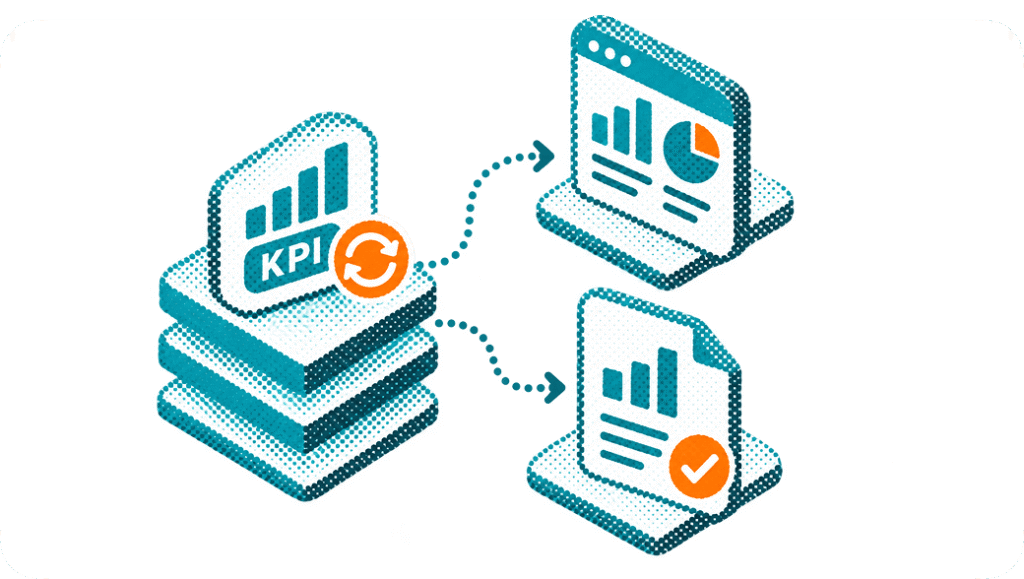
Business teams build dashboards and templated reports on the same model, whether for operations, sales, finance, HR or leadership. Every view reads from one definition.
06
Access follows roles
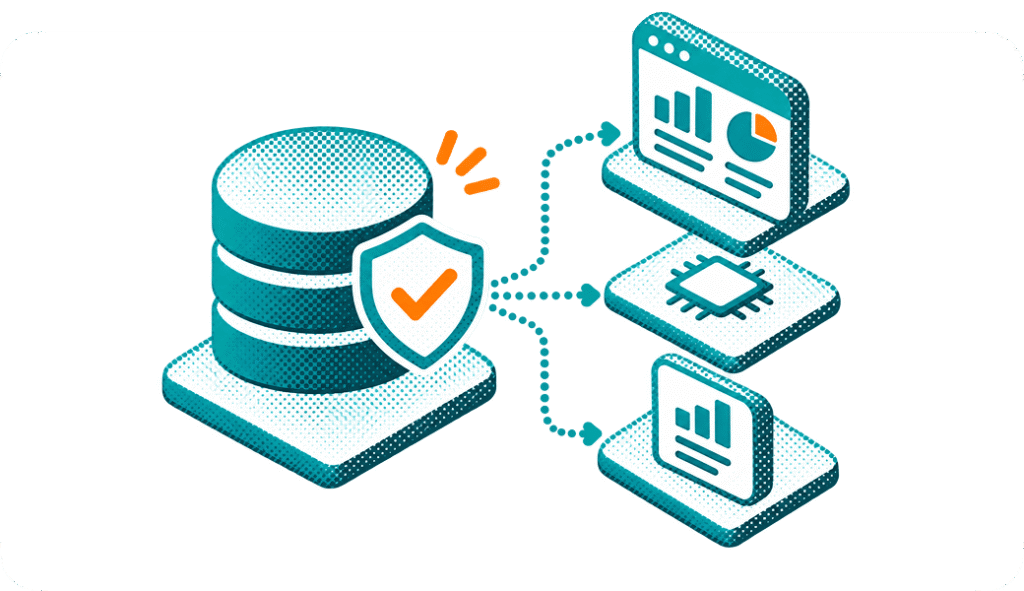
Tenants, users, groups, roles and permissions decide who sees what. A regional manager sees their region, leadership sees the whole business, and external reviewers can receive reports only. Governance applies at every layer.
07
Every figure can be traced
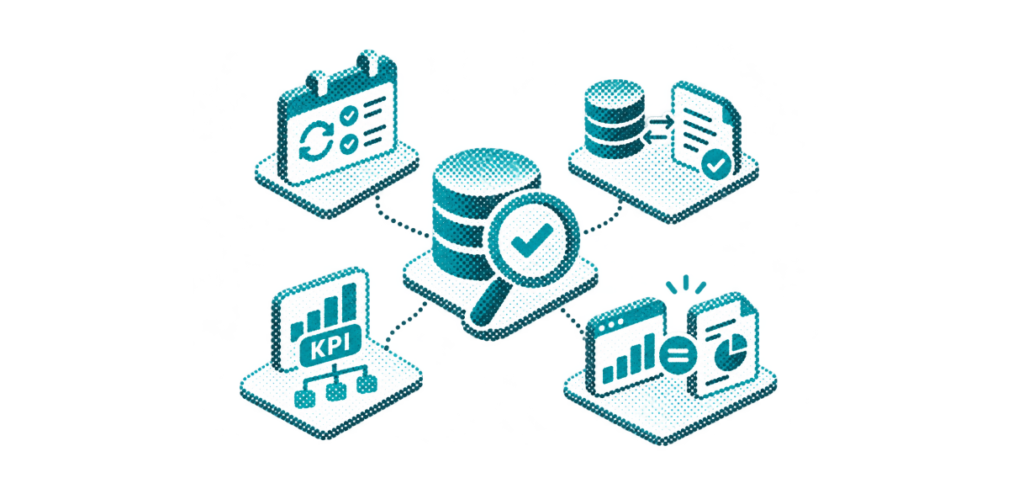
Anyone with the right access can follow a number from the report to the model definition, to the raw data, and to the original record in the source system.
What Happens, And Who Does It
For each layer, see what Datarept provides, what your team does, and what you can check.
Layer
Ingestion
Raw layer
Model layer
Experience layer
Datarept
Ingestion
Provides connectors designed for each source type and runs the scheduled pipelines
Raw Layer
Stores incoming data without alteration.
Model Layer
Provides the tooling to build environments, dimensions and analytical models.
Experience layer
Provides dashboards, Report Studio, templates, the AI-oriented dashboard and Crysa.
Your team
Ingestion
Chooses which sources to connect and how often data should refresh.
Raw Layer
Nothing to configure for basic operation.
Model Layer
Analysts define KPIs and relationships.
Experience layer
Builds the views and reports each group needs.
You can check
Ingestion
The status and history of each data refresh, if available in the product.
Raw Layer
That a stored record matches the source record.
Model Layer
How any KPI is defined and what feeds it.
Experience layer
That the same KPI reads the same in a dashboard and a report.
Working With Live Data
A report is only useful if its data is current. This is how Datarept keeps your numbers live.
Continuous Data Feeds
Connected systems feed the platform continuously, so you work from current data instead of one-off exports.
Real-Time Streaming
Devices, sensors and machines can stream events through MQTT, so live operational data arrives as it happens rather than on a schedule
Preserved Raw Data
Each update is added to the raw layer while the original data stays preserved.
One Current View
Models, dashboards and Chrysa read the latest data as soon as it arrives, so every view shows the same current figures.
Independent Update Speeds
Each source can update at its own pace, so a fast-moving CRM and a slower monthly finance feed don’t have to share one schedule.
Behind Every Insight
Discover how Datarept responds to changing business KPIs, keeps your reporting consistent, and transforms everyday questions into meaningful, actionable insights through Crysa, your AI-powered data assistant.
Businesses redefine metrics. Here is how that plays out in our data reporting solutions.
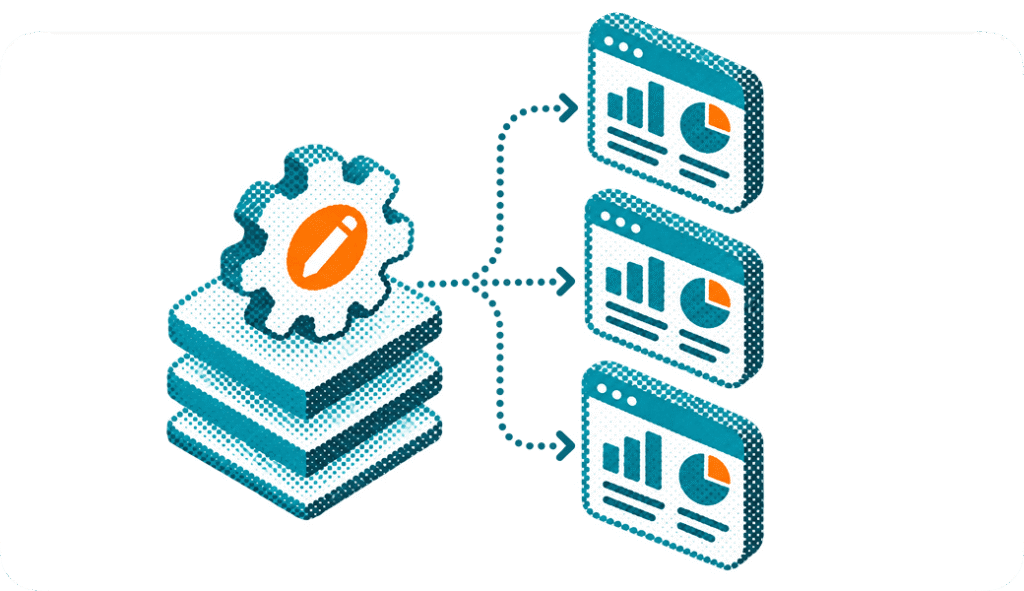
An analyst updates the KPI definition in the model layer.
Dashboards and reports built on that model use the new definition.
There is one change to make, not a fix for each dashboard.
The raw layer is unaffected, so the underlying data stays intact.
Because the answer comes from the same models as your dashboards in our data reporting solutions, a figure from Chrysa can be checked against a figure on screen.
You type a question in plain language.
Chrysa checks which reports, models and data agents you are permitted to access.
It answers using those governed sources.
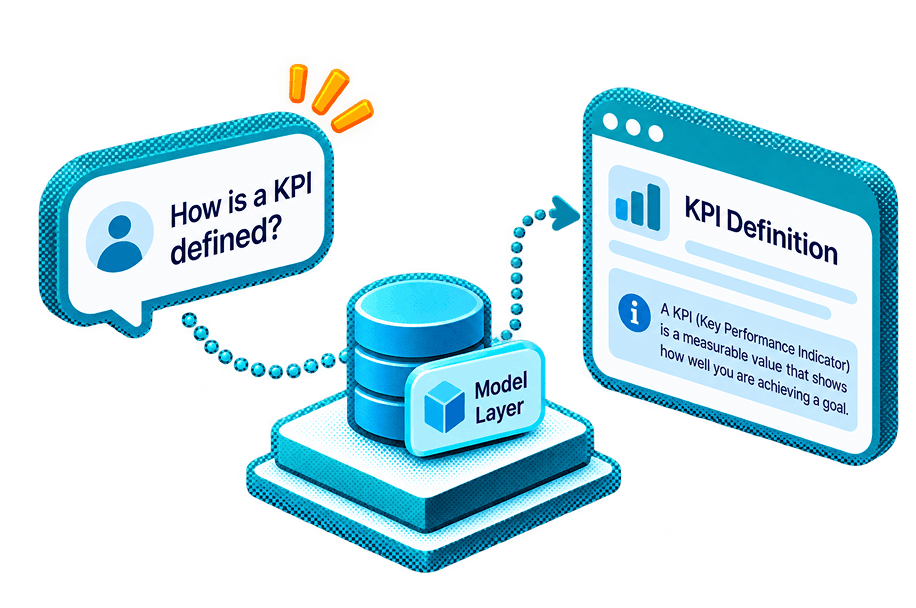
You can ask a follow-up, such as how a KPI is defined, and it answers from the model layer.
Ready To Evaluate Datarept?
See how it fits your systems, security and compliance needs.
Data reporting solutions typically move data from connected sources through ingestion and storage before it is modeled and presented through dashboards or reports. In Datarept, governance applies across every layer.
How can businesses keep reports consistent across teams?
Businesses can define KPIs centrally in the model layer and build dashboards and reports from those models. This allows the same KPI definition to be used across different reporting experiences.
How does Datarept keep dashboards and reports aligned?
Dashboards and reports can use the same governed model. This means a KPI can have one definition across different reporting experiences rather than being separately recreated for each dashboard or report.
How does Chrysa answer questions about business data?
Users ask Chrysa questions in plain language. Chrysa checks the reports, models, and data agents they are permitted to access and answers using those governed sources.
How does Datarept handle unstructured data
Images, audio, and video can enter through connected sources such as cloud storage. Embeddings are created and held in vector storage so the content can be analyzed alongside structured data.
Can Datarept support AI-based questions about reports?
Yes. Chrysa allows users to ask questions in plain language about the reports, models, and data agents they are permitted to access. Follow-up questions can also explore how a KPI is defined.